company provides vehicle. It’s a union job (open shop) straight hourly wage, time and a half over 8 or 40, double time after ten or 56. Max hours per day 11 1/2 with lunch. (Some overtime but rarely forced- might have to work 6 days a week sometimes)
2 Likes
You’re spot on, nothing over 70 pounds. And anything over 20 pounds is extremely rare.
Blockquote
1 Like
Another 236,000 dropped out of the national labor force in April
YIKES.
1 Like
The drop in participation rate is way over blown. Many babyboomers are retiring so of course it’s going to go down. I made a chart one time of retirees vs participation rate and bammmm…it’s structural.
But 236K is WAY over normal retiree exits, while the 164K of new jobs is simultaneously very sub-par.
1 Like
Please note that number is the net number of new jobs, not the gross number.
HEH.
You falsely assume everybody retires @ 65. Get real.
Also, I remember a number of months back, one of the financial programs (CNBC, NBR, OM, etc.) had a segment about the rising number of retirees going back to work.
Prior contemporaneous BLS monthly releases.
Eh, who claimed otherwise ?
It was your standard monthly non-farm payroll number release, which BTW prior to had a consensus of 195K-200K for April.
Just…why?..
2 Likes
Labor force is up by 930k so far in 2018.
1 Like
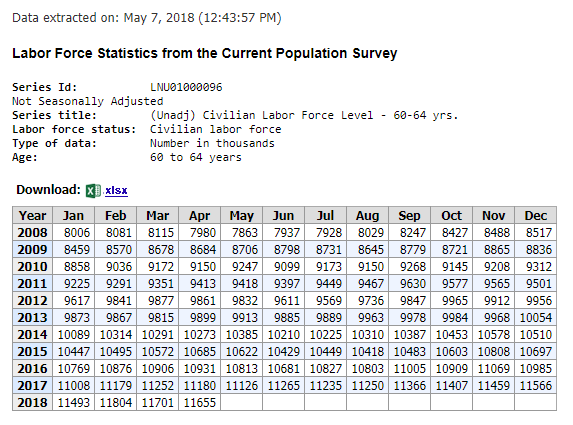
Only about 46k people age 60-64 left the labor force in April.
ETA : OK I’m double editing this…
The # of people over 65 in the workforce actually INCREASED by 45k.
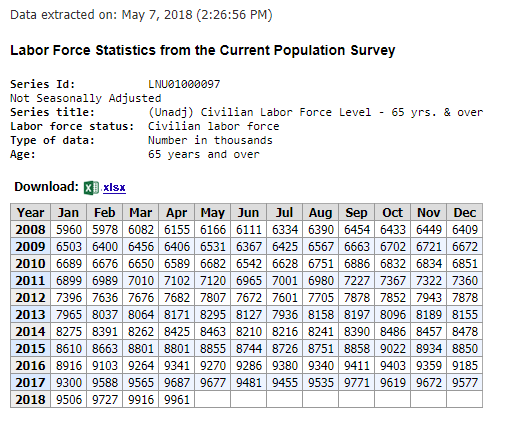
So net change for people over 60 years was just -1k.
2 Likes
Which is why the report of a drop of 236K in April was so shocking, and that the claim by Wakes that it was merely normal baby boomer retirements was so off-base.
The irony of the labor force participation rate is that able bodied people that should be working are leaving the labor force while at the same time people over 65 can’t afford to retire so they are re-entering the labor force.
1 Like
Be careful with reading too much into stats. It could simply be that more people turned 65 that month thus exiting on stat and entering in the next bracket. Combined differential of 1k would seem to point that way to me.
April 1953 actually had the least # of births for any month of the year. About 38k less than an average month for that year.
And really not that many people 60-64 left the labor force in April anyway.
No, You’re right the actual retirement ages vary.
In fact it seems that 62 is the average :
I bet a good % of those people retiring early are just as likely to do so involuntarily as voluntarily. Job loss or disability force a lot of people to retire before they wanted to.
I wasn’t personally meaning as if everyone retires on their 65th birthday. Honestly Id’ have assumed that the average would be closer to 65 than not but the gallup poll above says its 62.
If theres anything that causes at least some to retire at 65 its waiting out for full retirement benefits. But few people have traditional pensions that work that way anymore and few also have patience (or means) to wait for full social security retirement age when they can get it early at 62.
It doesn’t really matter what age it is. On any given day there’s going to be a certain number of people that turn that specific age. Without getting deep into the analyzing the months in which there are more births, a reasonable enough statistic for discussion is 1/12 of the number of people born x number of years ago. Doesn’t matter whether x is 65 or 62.4. The only question is whether the number of people born 65 years ago and 62 years ago (or whatever the average is) is close enough.
I don’t know if we can even assume that most people retire in the month of their birthday.
Sure, but it wouldn’t matter (unless you want to get into the weeds). If 50% of people retire in the month of their birth, and 50% retire in the month after, in January, 2000 you have 50% of the people born January, 1935 and 50% of the people born December, 1934 retiring (which is 100% of the people born in a given month assuming approximately the same number of people are born each month). Adding more months and years into the equation will net you the same result.
Looking at a single month’s worth of labor market changes is useless. You have to plot it on a chart/graph and look at the overall trend. It’s not like the baby boom came to an abrupt end. It tapered off.