You mean other than the percentage of uninsured dramatically declining. According to the CDC, from 1997 through 2013, the percentage of adults aged 18-64 who were uninsured increased, while the percentage of uninsured adults aged 18-64 decreased from 20.4% in 2013 to 12.4% in 2016.
According to the CBO, you “believe” wrong.
The CBO cited that the ACA added coverage to 23 million, extended the Medicare Trust Fund by 13 years, bent the national healthcare cost curve downward, reduced the federal deficit, with healthcare inflation since the ACA was enacted falling to its lowest level in half a century, all while coming in 33% cheaper than originally projected, thereby meeting or exceeding every benchmark the CBO set back in 2010.
Indeed, you posted about this at the end of March^. I’ll just requote my response:
Along with all the pre-ACA horrors, like charging lots more for pre-existing conditions, allowing recessionary rip-offs, discriminatory pricing, and on and on.
None of the above comments are inconsistent with a rising % of GDP spent on healthcare. Unless healthcare inflation was negative or reduced below the average rate of inflation of the GDP spending basket, which I find very unlikely, healthcare costs would continue to rise as a fraction of spending. Yes, Obamacare raised the % covered by insurance (quality of that coverage not withstanding), and all those new insurance premiums got paid for by someone, mostly the taxpayer, and again increased healthcare GDP.
the proposal to allow guaranteed renewal insurance, either stand alone or as riders to short term policies beyond a year, seemed new and possibly quite good for the average person. There would still be ACA policies, so you could preexisting coverage through them if you wanted and hadn’t paid for a renewable policy.
Note that some state laws currently limit or ban short term policies, so just because the Feds may expand their usefulness doesn’t mean your local government will.
Looks like most states will disclose the 2019 rate hike proposals sometime in June. You can keep up to date here.
Currently, 4 states have theirs done (MA,VA,VE,OR), with about a 15% hike average, in part accounting for the removal of the individual mandate penalties effective 2019 and the possibility of expanded short term policies. Narrower networks and higher deductibles are also expected, as BCBS for example explicitly cited that premiums would have been even higher without them taking additional measures to control cost (i.e. Limit your benefits). My ballpark is the average hike comes in higher than this once all the states are counted.
I have previously complained about how Obamacare destroyed by local PPO market. Interestingly, in VA for example, the PPOs still exist and are basically becoming the de facto high risk pool - very few enrollees, very sick, and those plans are seeing 50-100% rate hikes, while the HMOs see the more typical 10-20% hikes.
They were warned that the repeal of the individual mandate would cause premiums to spike, now they will be shocked, SHOCKED, that premiums are spiking, and falsely try to blame “Obamacare”.
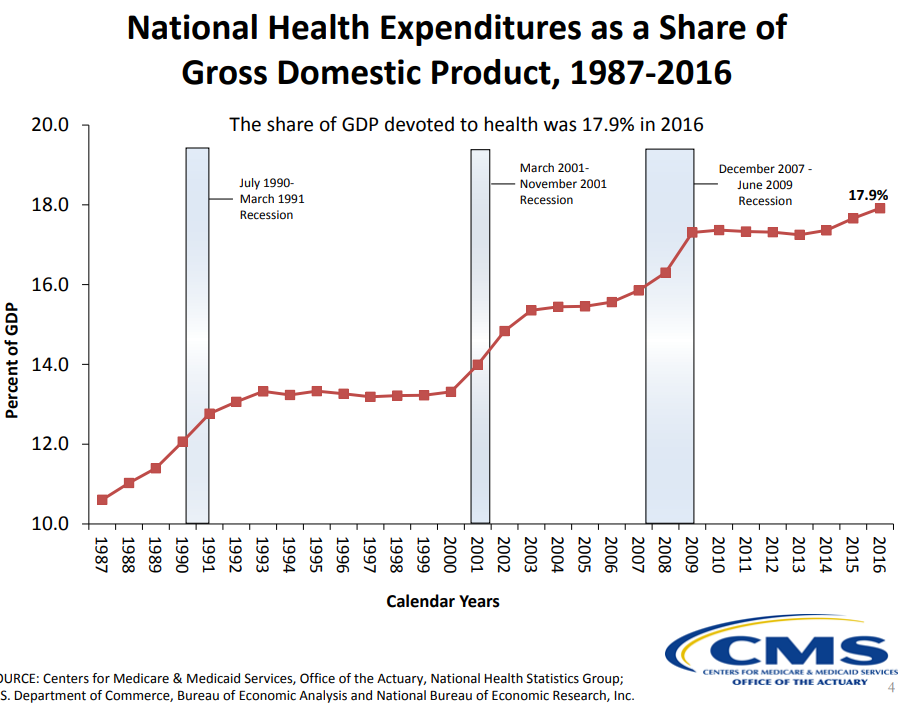
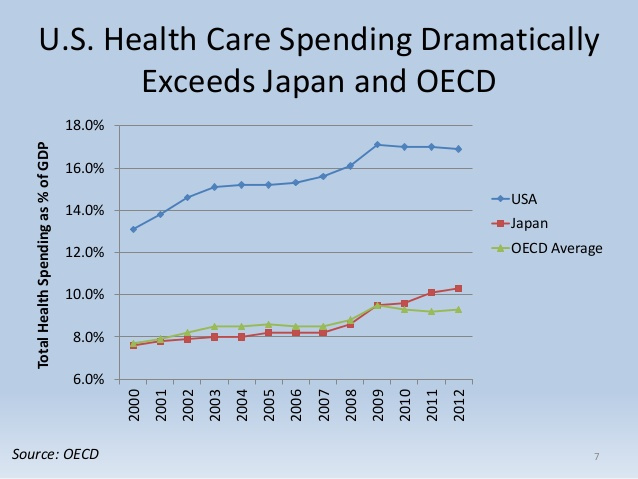
Thanks for the links, jcohen. Even though it was passed in 2010 and began collecting taxes in advance, Obamacare first took effect for calendar year 2014. You can see from these first couple charts from the same source that healthcare spending clearly increased as a % of GDP during the ACA yeara 2014-2016, having been roughly flat prior to that.
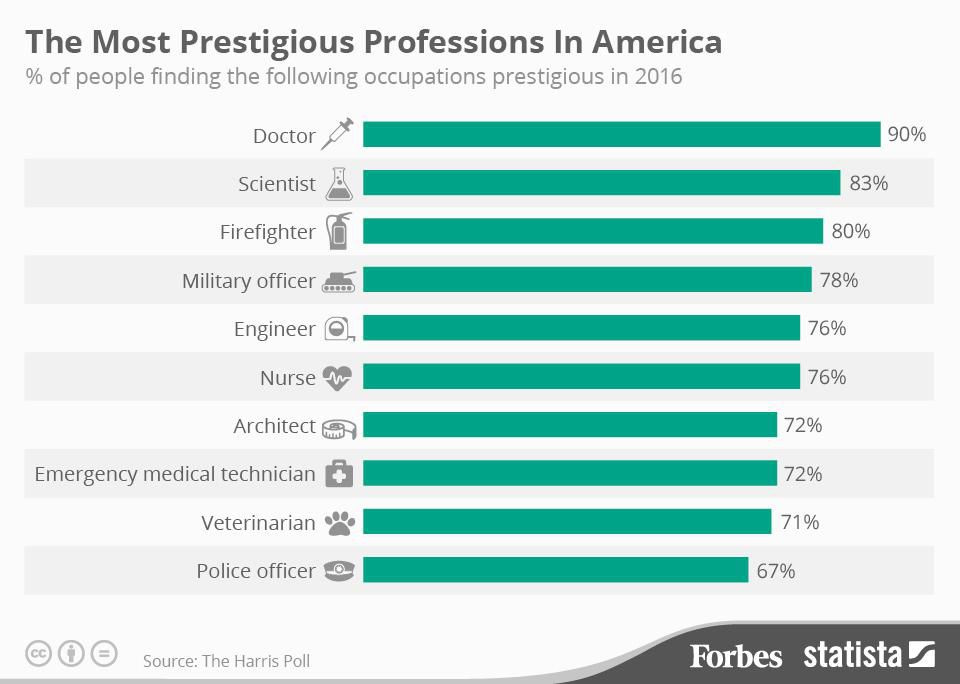
Medical professionals are making a lot less now (adjusted) than they were 15-20 yrs ago. They also have a lot less prestige. Let’s not attack groups of people for system failures. It’s like attacking teachers for the problems with the educational system.
Speaking of how the ACA tried to expand Medicaid everywhere (and managed to get almost 2/3 of states to buy into it), here’s a good article on how CVS uses their role as Medicaid intermediary to raise total drug costs while shifting profits to avoid the ACA’s half hearted cost control measurements and put independent pharmacies out of business.
In addition to retail pharmacies, CVS operates a pharmaceutical benefit manager (PBM) that acts as a middleman between insurers, pharmacies and drug manufacturers. PBMs decide which drugs are listed on a formulary, how much pharmacies are reimbursed and how much insurers pay.
Ohio contracts with five managed-care organizations (MCOs) to administer Medicaid benefits, four of which outsource their drug benefits management to CVS Caremark, the CVS PBM. The state uses drug claims data to set its annual drug budget. So if claims increase, the state will allocate more Medicaid funds for drugs the following year.
CVS is also attempting to drive independent pharmacists out of business and expand its retail market share. We spoke with eight current or former independent pharmacists in Ohio who complained that CVS has slashed payment rates below the pharmacists’ wholesale drug costs. They say CVS is pocketing the increased “spread pricing”—that is, the difference between what the PBM pays pharmacies and charges the state.
When Arkansas Independent Pharmacies obtained insurance explanation of benefits data from Medicaid patients, they found that CVS Caremark billed Medicaid plans more than twice as much on average as what their pharmacies got paid. Data from fully-insured commercial health plans showed that CVS paid itself over $60 on average more per prescription than independent pharmacists.
ObamaCare requires MCOs to spend at least 85% of all taxpayer dollars on patient medical claims and care improvements. The rest can be split among overhead, marketing and profits. Contracting with PBMs allows MCOs to off-load administrative costs and thus take more profit. Rising drug claims also let them pocket more money.
Basically, by being vertically intergrated, CVS can raise Medicaid drug costs (paid for by the taxpayer), while destroying competition by pricing Medicaid reimbursements to the end pharmacies below the wholesale cost. CVS is able to make up for losing at the retail level by making big profits at the admin/intermediary level. It’s like dumping cheap products on a market below cost to drive everyone else out of business, except here it’s entirely enabled by the poorly conceived government rules.
Healthcare practitioners and technical occupations are making $4.83 /hr above inflation vs 2000.
Healthcare support are making $0.25 /hr more vs 2000.
There are 8.5M and 4.1M people in those jobs respectively.
Based on the total employment and assuming a 2000 hours /year work then we’re spending $84.2B nationally on the wages for people in healthcare MORE than we did in 2000 after taking inflation in account.
Thats $250 per person.
If the industry wages had not grown faster than inflation we’d all be saving ~$250/year per person right now.
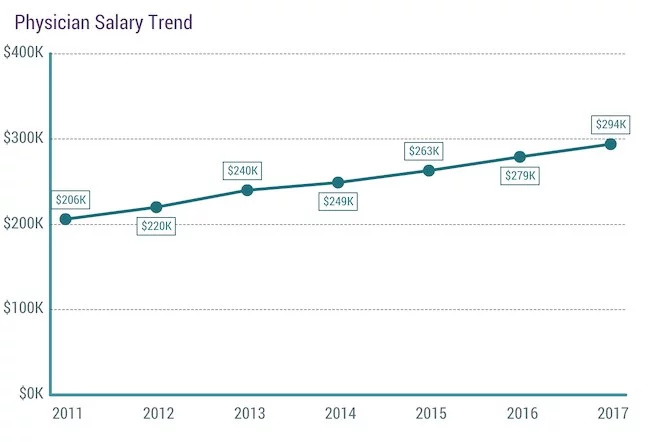
Physicians were getting good wage increases before ACA. Looking at the medscale salary chart above I don’t see any big change in the rate of increase before/after ACA. In fact the increase is marginally slower post 2014 after the major impacts of ACA hit. But that upward slope looks very consistent in the 3 years +/- ACA.
If you want to go back further you can plot the same kind of chart at the same pace of increase.
From 1987 to 2007 the rate went from 10.6% to 15.9%. Annual average increases of ~0.265%.
From 2014 to 2016 it did tick up 0.5% But thats inline with the general trend over the past 4 decades.
Also adding millions of people to the ranks of the insured is going to increase total costs.
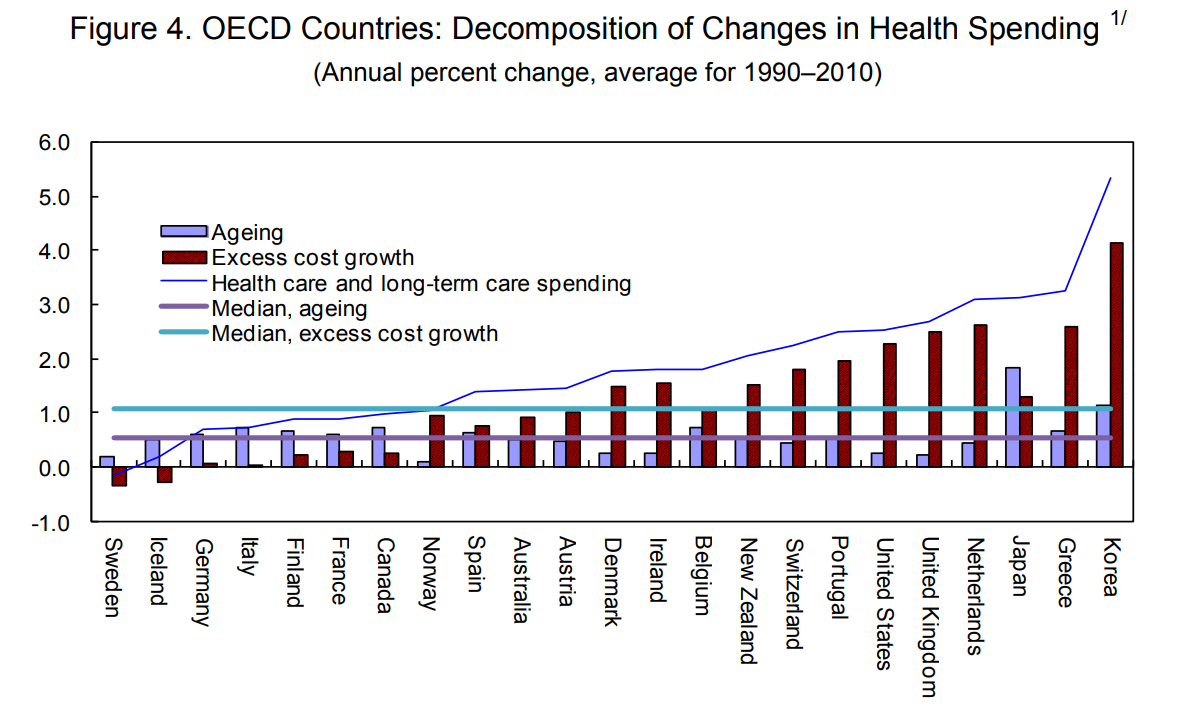
Demographics are also going to impact the spending as % of GDP over the decades. We spend more to insure the elderly and the nation is gradually aging. About 1/3 of the increase in the past 30 years is due to aging.
Are the technical occupations related to health care? Just trying to understand the statistics because I’d be surprised if most physicians get paid on an hourly basis.