I thought in-service mega backdoor was more common with after-tax non-Roth contributions… but even if both are available, I thought math was different. I’m asking because I don’t recall the actual difference, just had a shortcut in my mind about one being better than another.
You’re correct. After-tax contributions are all non-Roth but if the plan allows for in-service distributions, they can be distributed to a Roth IRA.
Between direct Roth IRA contributions and mega backdoor ones from after-tax contributions to 401l/403b, they should all end up in the same place eventually (Roth IRA). But for how they get there, I think the key differences are:
- straight Roth contributions are more often available than in-service distributions
- after-tax contribution limits are higher ($69k/yr vs $23k for Roth 401k)
- more limited investment options/portability in Roth 401k than Roth IRA. Fees may also be different (plan management fees and institutional/investor asset class ones).
- in-service distributions to Roth IRA may incur some tax on conversion of small amount of earnings
- distributions of after-tax contributions to Roth IRA need to be reported annually on Form 8606.
2 Likes
Food prices don’t fall. Good article on how inflation hits regular people due to rising commodity costs (from money printing imo) and mandated higher labor costs from minimum wage laws.
3 Likes
Especially in Pennsylvania? Has anyone checked California?
As the Keystone State saw inflation last year dig deeper into residents’ wallets than any other state, one Philly-based food supplier is warning that the fight may not be over yet.
The Philadelphia-based produce supplier has been caught between higher input costs and consumers struggling to pay for inflationary prices. According to ConsumerAffairs, Pennsylvania saw the highest grocery inflation rate of any state in 2023, at an 8.2% increase year-over-year.
1 Like
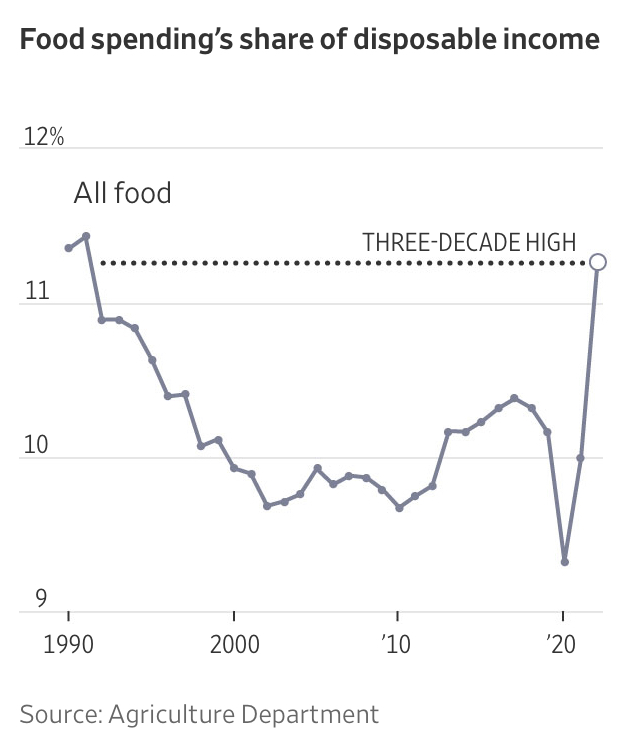
Food spending as a fraction of disposable income can be explained many ways, especially since that percentage is not identical among all income levels.
I have not noticed any material difference in food costs with respect to my income growth personally. My income has grown by 29% in the past 5 years (based on AGI since I just finished filing taxes) but according to Empower spending report, I’m currently spending about 13% more on food than in 2019.
Even then, it’s still less than 1% up from 5 years ago on the graph. On current median household income of $75k/yr, that’s $14/wk more on food.
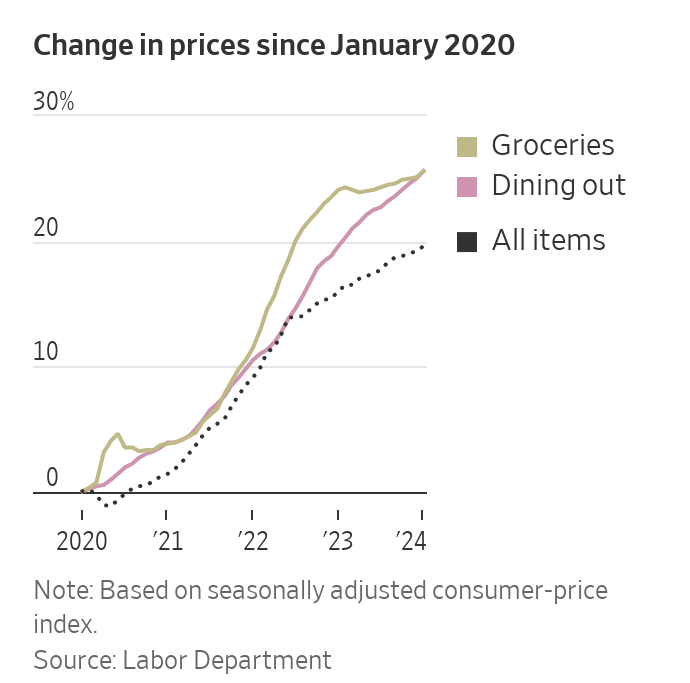
Anyway, I’m not sure about the dining out vs groceries inflation chart. Same inflation for groceries or dining out since 2020 seems off to me. I can shop for 15-20% more on groceries than 5 years ago but I certainly cannot dine out for that same 15-20% extra. It’s close to 40-50% up at the restaurants I go to. I suspect most of it from wages. My kids worked part-time in high-school. In 2019, hourly salary was $10-11/hr. My youngest is now earning $16.50/hr. Pretty much 50% up from what his sister made in 2019-2020.
1 Like
I’ve noticed that it really depends. At fast food restaurants, it’s definitely true almost universally. McDonalds is sort of the media’s poster child for this, but they’re all guilty of it. We were connecting through HNL this past November and needed to pick up something quickly. The double whammy of Hawaii and the airport led to 2 value meals for $36… ouch. Well, it’s either that or starve on the 5 hour flight home.
The only restaurant I’ve seen in this sector that hasn’t done this is Domino’s, whose pricing seems almost identical to pre-pandemic times.
For nicer sit down places - i’d say it’s closer to 20% or 25% or so depending on the restaurant. The local steakhouse we like has skyrocketed in price, but on the flip side the wine bar/restaurant we frequent has gone up much more modestly. We rarely go into Seattle; a number of those downtown restaurants have started tacking on 5% fees that are retained by the restaurant. I don’t know why they do this, it’s a lot easier to hide a 5% price hike in a $40 entree than it is to itemize it out on the bill. It just ticks off your patrons.
For the really top tier places… it’s more focused on shrinkflation. My parents got us a gift certificate to a restaurant called The Herbfarm that does themed chef’s menus - we went this past weekend. It is arguably the best restaurant in the state of Washington. The pricing was almost identical to what we paid for in 2019, but with one fewer course and clever choices for ingredients.
I remember in years past they would have something like elk or Alaska copper river salmon as the main. This time it was braised lamb shoulder and a tartare - cheaper for sure but they still did amazing things with it.
3 Likes
My apologies if this question doesn’t belong under this thread. Please, relocate it as you see fit.
I’m new to Treasury notes, having only bought short-term T-bills before. I bought a 2Y note @ $99.8771. The indicated interest is 4.62%. I don’t understand what the $99.8771 represents. I was expecting something similar to when I buy a 24-month CD, i.e. I pay the full amount up front and then get the interest every certain number of months.
I’ll appreciate it very much if you could point me in the right direction to understand the difference.
That’s the current value of the note you purchased. That discount, plus the coupon rate, is what yields the indicated 4.62% until maturity. Without the discounted price, the yield would be lower.
Sometimes they’re sold at a premium, meaning the yield to maturity is lower than the coupon rate.
Thanks so much for the explanation!
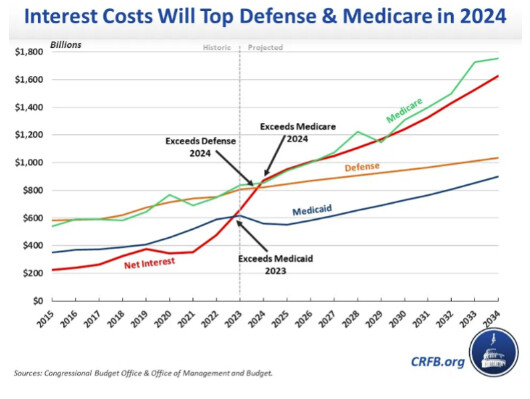
Good high level summary of the high spending and rising debt / interest expense vs other government programs. It’s not pretty.
3 Likes
Not sure why this is pinned on Bidenomics alone. Both Trump and Biden have been criminally guilty of aggravating a situation that was already poor.
https://fiscaldata.treasury.gov/datasets/debt-to-the-penny/debt-to-the-penny#preview-and-download
According to the Treasury dept., Trump grew the national debt held by the public (the more meaningful measure) from $14.4T in Jan 2017 to $21.6T in Jan 2021 so $7.2T extra or a growth of 50%. In March 2024, it’s now at $27.4T so Biden added +$5.8T on track for +$7.3T given another 10 months. It’s virtually identical in raw dollars but adjusting for GDP, it’s not quite as bad.
According to the St Louis Fed data (https://fred.stlouisfed.org/series/GFDEGDQ188S, as a percent of GDP, at end of 2016, it was at 102.6% of GDP. At the end of 2020, it was 126.0% of GDP. Since then, it’s been pretty constant or even slightly down (121.7% of GDP at Q4 2023), mostly because Congress has blocked some of the crazy spending proposals from the Biden administration (bloated infrastructure, student loan more generalized bailout).
Call me cynical but I’m not expecting a major change of trajectory from either of these 2 way-past-expiration-date clowns. I bet that despite all the payoff the debt fake promises both will spew out, both will assuredly cave in and extend the absurd TCJA further adding to the debt for another decade.
2 Likes
That also isnt exactly fair, either. A lot of that is COVID debt, not policy debt. Same with the percentage of GDP. In 2020, GDP took a hit while a lot of one-off debt was added. Both of which only inflate the percentage.
It’s like when they blame Biden for sky high gas increases, they always start the comparison and measure the increase from early summer 2020, when they [almost literally] couldnt give away oil.
3 Likes
At that rate Biden’s also responsible for some COVID debt since he oversaw the 3rd COVID stimulus. But you don’t get to pick and choose what debt is not policy and what debt is policy. It’s all policy. Voted by Congress, signed by POTUS. Nobody gets a pass. Otherwise I’m sure all the budget deficit will find a convenient excuse for not being the fault of those who voted for them.
Both are fitting a pattern of governing by crisis. Not doing anything until it’s too late. Not planning for antifragility to unpredictable events. Case in point, the unnecessary TCJA reduced tax revenues, produced little added GDP (much much less than advertised if any) and made the US less able to financially absorb the next crisis (COVID).
As proof, not all countries bumped their debt to GDP ratio by 25% because of COVID. Germany only increased their debt to GDP by 9% during 2020 and have since then reduced by 4% (back down to below 65%). And all this despite being way more affected by energy price disruption from the Ukraine war.
Not saying Biden did any better to reduce the US fiscal fragility but drawing attention to Biden’s deficit policies due to frivolous spending (not in contest) while glossing over the same frivolous fiscal stimuli policies and inept tax cuts from the Trump administration is misleading at best.
I maintain that both of them have been - and likely will continue to be - two different brands of extremely fiscally irresponsible Presidents. To be fair, the blame lays also very much with Congress. In the last 7 years, we had 100% GOP, split GOP/Dem, and 100% Dem Congresses, and all of them have happily abated bills leading to bloated budget deficits.
That’s why I think we need a rule that all policy makers should be ineligible for re-election if they oversaw budget deficits during their previous term in office. Maybe then we’d have a return to spending and tax reforms actually paid for.
2 Likes
This is before the $20 per hour California minimum wage starts.
The receipt shows that a bacon cheeseburger was sold for $12.49, along with a regular soda priced at $2.89. A small portion of fries was also added on – for a whopping $5.19.
The order total came to $21.91 with tax, and the buyer added a $2.19 tip – bringing the grand total to a pricey $24.10.
Many fast food restaurants have raised prices as inflation soared above 9% at its peak. While top line inflation has come down, prices for many food items remain elevated. Beef prices are up over 7% and steak over 10%, according to the consumer price index’s latest reading.
2 Likes
I think this was in NYC so probably not gonna feel the increase in CA minimum wage… ![]()
Besides, I’m not sure that’s gonna be responsible for moving the costs all that much when this chain already operates at absurdly inflated profit margins. That burger meal costs about $2.50 to make at home, large restaurant chains would have even lower costs. Let’s be generous and this meal required 3-min of labor. If minimum wage was increased from $15/hr to $20/hr (+33%), 3-min costs an additional $0.25 for this $24 meal.
California says hold my beer, or is that Coke?
2 Likes
The materials and time to make a single burger are a small fraction of the cost to the restaurant. As an example, the ingredients have to be ordered, received, processed and put into refrigerators, prepared to be used during the cooking. The restaurant and all the cooking areas need to be cleaned. I’m sure I’m leaving out a lot of other required labor
A better way to look at this is to look at the fraction of the restaurant cost attributable to labor. According to this website, Labor costs are about 30% of their total gross expenses. As I recall, the previous minimum wage was $15 an hour so $20 is a 33% increase. So their gross expenses will increase by 10%.
https://pos.toasttab.com/blog/on-the-line/restaurant-labor-cost-percentage
How to Calculate Your Restaurant Labor Cost Percentage
1 Like
I don’t know if the 30% holds true for fast food restaurants too. But even then, 10% was the tip on that $24 meal. Yeah $26.5 would be worse but at that point, it’s only a few more degrees of outrageous.
The national average for a gallon of regular unleaded was $3.40 as of Thursday, according to the organization’s data. In California, the average was $4.87, more than any other state.
Several factors go into what drivers pay for gas, including refining costs, taxes, distribution and marketing, and crude oil prices, according to the U.S. Energy Information Administration.
High taxes are partly to blame in California. The state has the highest gasoline taxes in the nation, according to EI
An isolated market and a special fuel blend
California requires a special blend of gasoline that reduces pollution — and costs more money.
“California also has seen a drop of 66% in the amount of refineries in operation from where we were 40 years ago,” said Patrick De Haan, head of petroleum analysis for GasBuddy. “So there are fewer refineries producing this special blend of gasoline.”
2 Likes
State taxes are about $0.45 of that difference (CA is $0.78, average is ~$0.34), so about $1 extra for the special blend and like 3 refineries (actually it’s 17 or 18, but only feels like 3 when one or two of them shut down for repairs).
I don’t like paying extra, but I hear the air is also much cleaner than it was some years ago, so maybe it’s worth it ![]() .
.