I never made any argument about any racial inequity in the tax code. I said the opposite.
But you are replying to posts about an article that is exactly about that!
1 Like
Expected changes for 2025/2026 if the Trump tax cuts expire.
2 Likes
Whoever controls it, the 2024-2026 Congress is gonna have fun with this for sure. If they let the TCJA income tax brackets and small business deduction sunset while leaving the corporate tax rate low, good luck selling that record for the 2026 midterm. Only potential silver lining (for a Congress not passing any new tax reform law) will be, that by Nov 2026, taxpayers will not have filed their first taxes post TCJA so some may not realize what’s coming.
What’s everyone’s sense of the likelihood of the TCJA provisions sunsetting without any action from Congress? My guess is pretty high considering recent dysfunction.
Promises promises
President Joe Biden’s nominee to run the Internal Revenue service pledged on Wednesday not to raise tax audit rates for U.S. households and small businesses earning less than $400,000 a year as the agency implements $80 billion in new funding
Meanwhile, the upper middle class is where the money is
https://www.wsj.com/articles/irs-tax-collectors-audit-middle-class-tigta-5071d622
The report examines IRS progress on mandates from the Biden Administration backed by tens of billions in new funding. The first supposed goal was to audit more ultrawealthy and fewer middle-class filers, but it’s not going so well.
most recent data suggests the IRS is still focused on the middle class. As of last summer, 63% of new audits targeted taxpayers with income of less than $200,000. Only a small overall share reached the very highest earners, while 80% of audits covered filers earning less than $1 million.
1 Like
So 17% of audits cover filers between $200K and $1m, which make up roughly the top 5%, and 20% of audits (which doesn’t sound like “only a small overall share”) cover filers earning more than $1 million, which make up less than 0.5% of the population. What’s the problem? Didn’t we just discuss a similar issue related to numbers being thrown around without any thought given to proportionality?
1 Like
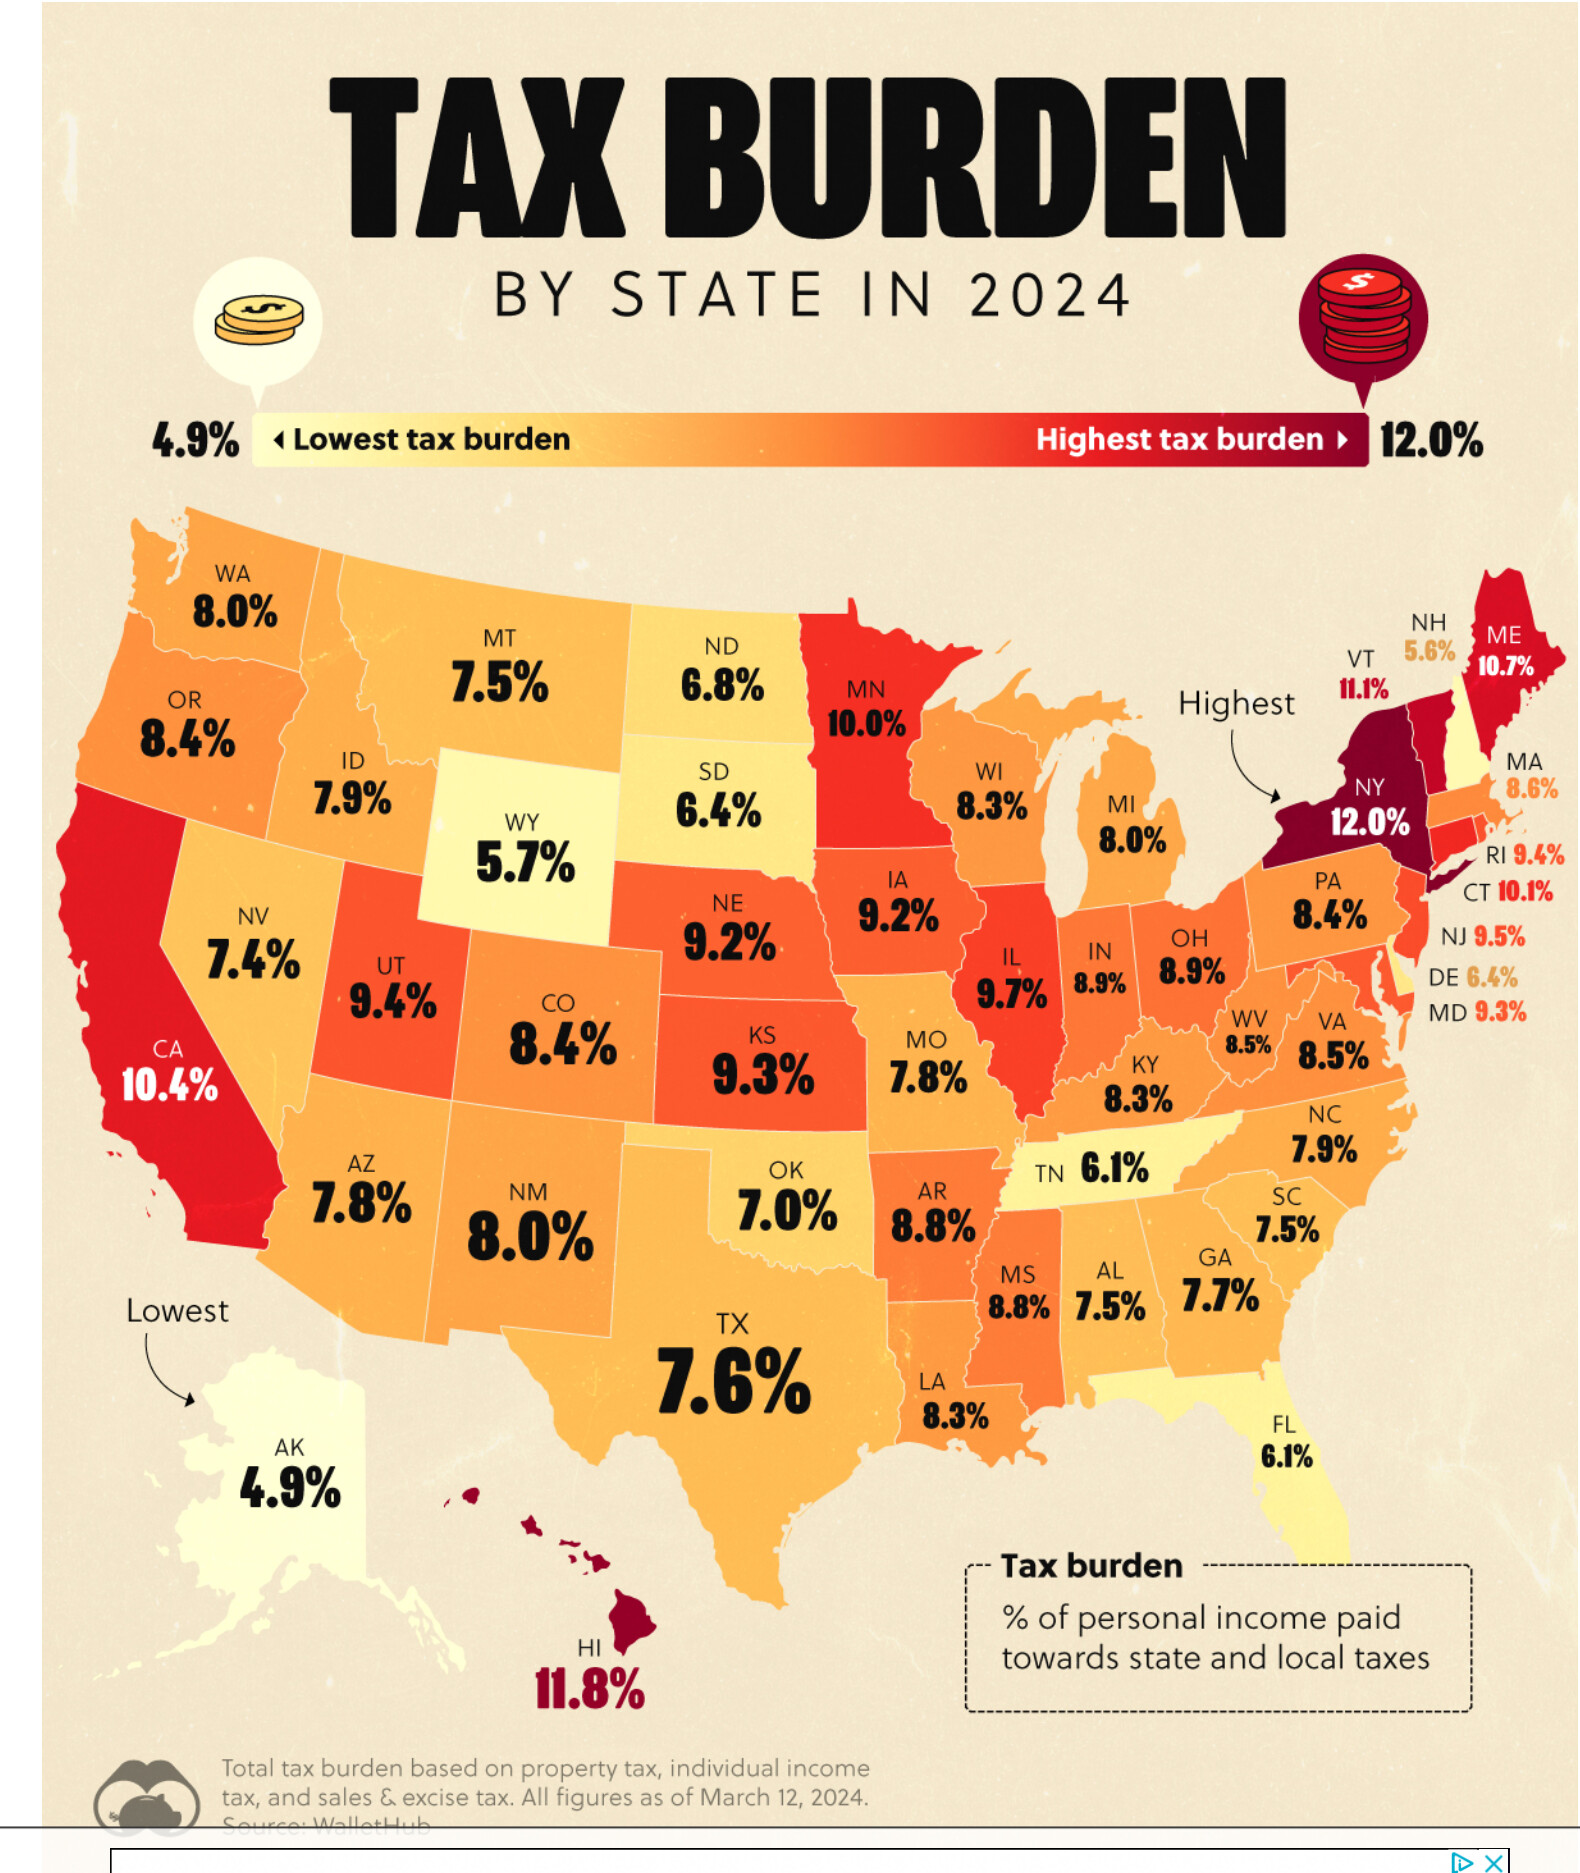
Don’t know how they calculate the data. Wyoming, Florida and Tennessee look good
Edit. The methodology and source of data are described here
1 Like
Many of the states with a higher tax burden also have higher incomes. They should create a map that combines the two concepts. Even better if it’s cost of living vs income.
The main issue with such a chart is that it assumes an average persons income in that state, to calculate both the income tax burden, sales tax, property tax, etc. these days, many higher income jobs are more mobile (work from home) and you can get a much bigger benefit than the headline differential of the chart. Specifically, your property tax kinda maxes out on whatever a nice house costs, sales tax only scales with consumption not income or investing, and income tax on the high end is the big driver with places like CA / NY having much higher marginal brackets vs zero in places like TX / FL.
The other caveat of such maps is that it’s not tailored to tell someone a precise prediction of their tax burden because it assumes the average person, living in an average household and house, etc.
For example, if you’re a retiree over 65 living on social security maybe with some added investment income, the picture is completely different. In this case, consumption tax becomes a more significant portion of your overall tax burden since you’re favorably taxed on income, and often also on property taxes (some states keep them constant after a certain age). Or if your income stream comprises a lot of interest and dividends then New Hampshire isn’t as attractive for you as the map suggests.
Another caveat is that the methodology somehow ignored state estate and inheritance taxes. Maybe because many are being phased out and/or have a relatively high exemption for the average person.
1 Like
Instead of looking at the details of the calculation, what about looking at the benefit of the taxes to the taxpayers? Are the benefits provided by the state government of New York worth twice as large a fraction of the taxpayers‘ income as the services provided by Florida? People are voting with their feet and many more people are moving from New York to Florida.
Sounds like a good idea. I didn’t see a chart like that on the site you linked.
How many? From what I see it’s somewhere around 70K per year. I imagine lots of them are wealthy or retirees, which makes sense because at the high end the benefits of the taxes are insignificant in ANY state, so for them it’s better to pay as little as possible. But relatively speaking (relative to total population, migration, and immigration) it’s not that many people.
Probably not happening. You’d need to define and quantify benefits like infrastructure, healthcare access, services, quality and cost of state-supported education, etc. And you’d have to ascertain which of the state-provided benefits the median taxpayer actually uses as well. That’s a lot harder to put a number on than how much the median taxpayer pays in 3 types of taxes.
2 Likes
They* already make charts of best cities to live in using the very benefits you outlined. If they can do it at a city level, they could do it at a state level. I agree though it’s not as easy, but also not as useless.
*I forget who, I wanna say nerdwallet.
Old post, but … three scenarios (out of many) that I will address
Trump wins with a conservative legislative branch - TCJA renewed/extended/epanded
Trump wins with a wishy-washy legislative branch - TCJA renewed for a finite term
Trump wins with a liberal legislative branch - TCJA possibly renewed to a date beneficial for liberals / progressives / commies / hamas / terrorists
1 Like
How the pitch for this? When TCJA was put in, it was argued that the cuts would be paid for by increased growth. As expected GDP growth - if any - came nowhere near the levels at which the cuts paid for themselves and 7 years later, it’s been amply clear that the cuts are a continuing large contribution to budget deficits. How do you sell the same cuts - let alone more cuts - to a traditionally fiscally-prudent (at least more than Dems) when the current TCJA cuts have already proven to be deficit-producing?
Final question to summarize scenarii, which one leads to TCJA cuts expiring as planned? Biden + GOP Congress?
P.S.: May 8th CBO report priced the full extension of TCJA as adding $4.6T in extra deficit over the next 10-years: https://www.cbo.gov/publication/60114
I hope they at least keep the part of TCJA which got rid of the marriage penalty in the federal tax brackets. It made no sense. The government policy should be to encourage people to get married AND keep participating in the labor force once married. The marriage penalty was pushing against that.
1 Like
Sure TCJA made the MFJ brackets exactly double as that of single filers. So it did remove some of the marriage penalty by adjusting brackets but it also introduced others. Like the cap on SALT deduction for example. Two unmarried individuals filing separately essentially get double the SALT deduction cap than that of a married couple.
And the TCJA did nothing about head of household filing status for unmarried couples with children being more advantageous than married filing jointly status. Or the earned income tax credit being greater for 2 single low-income filers than a married couple.
For sure, if TCJA is not replaced by anything, the marriage penalty will be greater for many couples. But if any new tax law replaces it, will have its work cut out to make the penalty (or marriage bonus for couples with dissimilar incomes) disappear.
2 Likes
Wow! Rather than stand here dumbfounded with my mouth open, can you point to me to the actual numbers on which you base each of those statements/accusations?
We don’t have great internet at the moment, so would appreciate specifics that I can check. Thanks.
In 2017 and 2018, the CBO priced the impact of TCJA on debt:
Those were confirmed by the Joint Committee on Taxation reports at the time: JCX-67-17 | Joint Committee on Taxation
Meanwhile, here’s a chart of the last 10 years of GDP: U.S. GDP Growth Rate 1960-2024 | MacroTrends
Take away COVID blips in 2021-2022 and it’s basically unchanged so corporate tax cuts did not result in higher GDP. But they did contribute to 31% less corporate income tax receipts in 2018 (first year after enactment) https://www.cbo.gov/system/files/2018-11/54647-MBR.pdf
After 2 years, CBO released another report confirming tax revenues had declined since TCJA: https://www.cbo.gov/system/files/2018-11/54647-MBR.pdf
Confirmed by the treasury with an annual deficit in 2019 of nearly $1T: Treasury: 2019 Deficit was $984 Billion-2019-10-25, which was 26% greater deficit than 2018 and 48% more than 2017 (before TCJA). That report also points specifically to the TCJA in chart analyzing the various contributions to this deficit.
So doesn’t get much clearer than this. TCJA cut taxes, did not result in GDP growth (or in fact wage increases which was another selling point but not as salient for this discussion) and was traced back directly by 3 governmental offices as responsible for significantly increasing deficits.
To me, the fact that the CBO estimates prior to the law actually under-estimated the contribution of TCJA to deficits, makes their estimates that extending the cuts would cost $4.6T over the next 10-years even more alarming since it’s likely that number could also be underestimating the true costs, especially in a high-interest rate environment for longer.
3 Likes