In these changes, the BLS is basically re-allocating its seasonal adjustments, which have no effect on the annual numbers. In essence, annual inflation of 6.5% is being reallocated across the 12 months of 2022. However, you have to wonder how consumers and financial markets would have reacted to slightly higher monthly inflation numbers in the last quarter of 2022, when “disinflation” suddenly became a buzzword.
The Reuters report on this change noted that the revisions could indicate a slight uptick in inflation in coming months:
My comment:
I’m getting increasingly uncomfortable that an agency of the very federal government whose spending has a big part in causing inflation determines the inflation adjustment of tips and ibonds.
Budget office telling us we’re in trouble on our debt.
U.S. Could Become Unable to Pay Bills as Soon as July, CBO Says --WSJ
CBO: BASED ON CURRENT TAX AND SPENDING LAWS, THE US DEFICIT WILL AVERAGE $2.0 TRILLION PER YEAR FROM 2024 TO 2033.
THE CONGRESSIONAL BUDGET OFFICE PREDICTS THAT THE US BUDGET DEFICIT WILL BE $1.41 TRILLION IN FISCAL YEAR 2023, UP FROM $1.375 TRILLION IN FISCAL YEAR 2022.
CBO Estimates U.S. Could Exhaust Extraordinary Measures Between July and September
CBO Says Forecast for When U.S. Could Default Is Uncertain
Treasury Has Said Measures Could Be Exhausted as Soon as June
CBO FORECASTS US AVERAGE UNEMPLOYMENT RATE AT 4.7% IN 2023, 4.9% IN 2024, 4.7% IN 2025.
CBO: WE FORECAST THE FY 2024 DEFICIT AT $1.576 TLN OR 5.8% OF GDP, 2033 DEFICIT AT $2.851 TLN OR 7.3% OF GDP.
CBO FORECASTS: REAL GDP GROWTH IN THE UNITED STATES IS EXPECTED TO BE 0.3% IN CALENDAR 2023, 1.8% IN 2024, AND 2.7% IN 2025.
CBO: WE FORECAST PUBLIC DEBT AT 98% OF GDP IN FY 2023, 118.2% OF GDP IN FY 2033.
CBO: WE FORECAST 10 YEAR TREASURY YIELDS AT 3.9% FOR 2023, 3.8% FOR 2024 AND 2025.
CBO FORECASTS: THE FORECAST DEFICIT FOR 2023-2032 IS $3 TRILLION HIGHER THAN IT WAS A YEAR AGO.
CBO FORECASTS: APRIL INCOME TAX RECEIPTS WOULD HAVE A SIGNIFICANT IMPACT ON THE TIMING OF POTENTIAL DEBT SERVICING ISSUES.
CBO: IF RECEIPTS FALL SHORT OF EXPECTATIONS, THE TREASURY’S EXTRAORDINARY MEASURES MAY BE EXHAUSTED BEFORE JULY.
CBO FORECASTS: THE US TREASURY WILL EXHAUST ITS BORROWING CAPACITY SOMETIME BETWEEN JULY AND SEPTEMBER IF NO ACTION IS TAKEN TO RAISE THE DEBT CEILING.
CBO: WITHOUT INCREASING OR SUSPENDING THE DEBT LIMIT, THE US GOVERNMENT WOULD HAVE TO DELAY MAKING PAYMENTS FOR SOME ACTIVITIES, DEFAULT ON ITS DEBT OBLIGATIONS, OR BOTH
Following up on Pakistan’s subsequent bankruptcy, accelerated by high energy costs.
He said that the rulers of the country were begging the International Monetary Fund (IMF) for the 23rd time in 75 years, adding that Pakistan’s debt had increased by 23 per cent in just one year.
Just like in Sri Lanka, Pakistan is broke in great part because of corruption. The same families have been in power for generations; the same domestic conglomerates control the economy, and graft is a god-given right. Those problems are common in the developing world.
Corruption in those countries permeates even the judiciary in blatant ways. The developed world has corruption but it isn’t at the same scale, or with the impunity seen in some of those other countries.
I suspect you’ve never lived in the (insert your favorite political party here) strongholds of Chicago or New Orleans. That’s the way it was 40 years ago. I suspect other cities have gone that route as well.
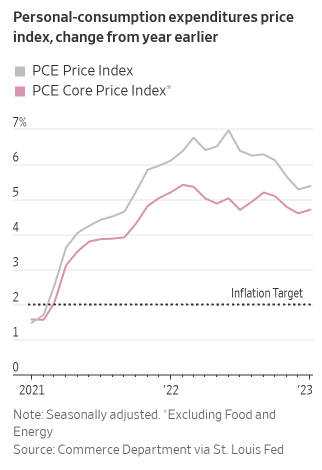
Excluding volatile food and energy prices, so-called core inflation rose 0.6% from December, up from a 0.4% rise the previous month. And compared with a year earlier, core inflation was up 4.7% in January, versus a 4.6% year-over-year uptick in December.
Added. Interest rates are up with the 10 year treasury rate 3.97%
I actually read a good part of it. The guy certainly does not believe in brevity. Liked this comment about my favorite sector
Energy sector earnings surged from contributing negative 8% in 2020 to a positive 4.5% contribution in 2021 to a whopping 12.5% contribution in 2022. Had energy profits not grown to records last year, the index would have seen EPS drop from $208.21 in 2021 to ~$183 instead of an estimated $200.12 including energy. With the sector contributing 12.5% to profit in 2022 but only comprising 5.2% of market cap and trading for only 8x earnings, stripping energy makes the index still that much more expensive. The energy sector comprised as much as 12.3% of index market cap as recently as 2011.